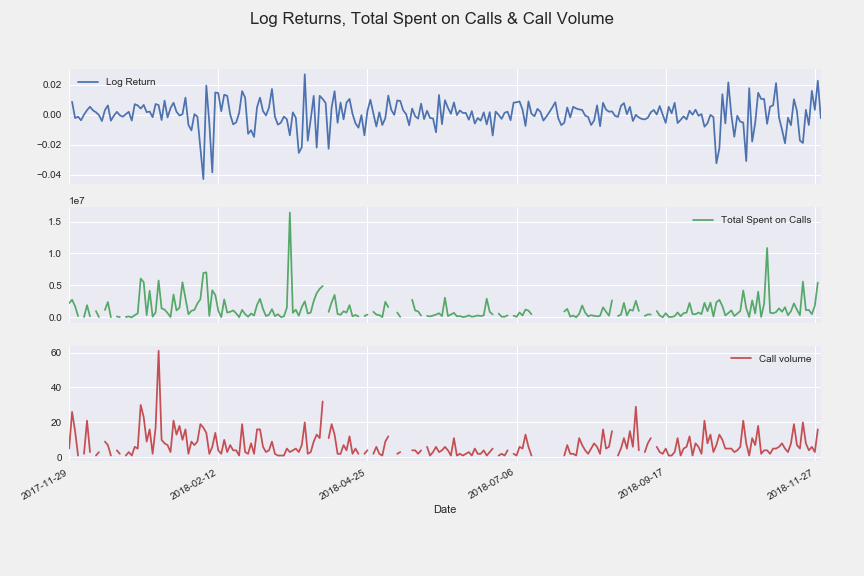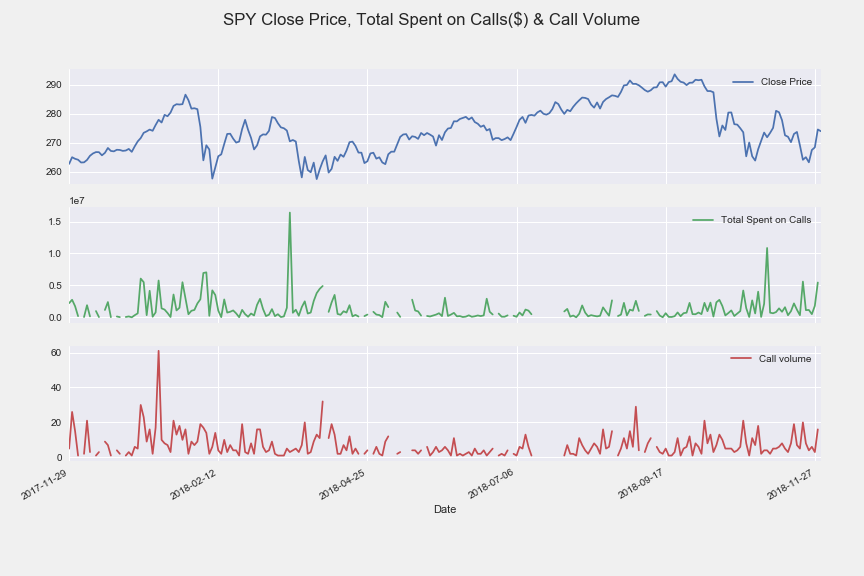
Closing Price, Total Spent on Calls and Call Volume
Similar to volume analysis, analyzing how much a trader spends on their position could be a sign of confidence in the direction of the market. The graphs display the SPY closing price along with the total spent on call options for the day and the volume of calls for the day. One interpretation of the data is that investor confidence was low from May through August after the market corrections that occurred in early 2018 because traders are neither buying many calls, nor spending a lot on their trades. That is an indication the climate consisted of low-confidence speculative trading.
Visualizations
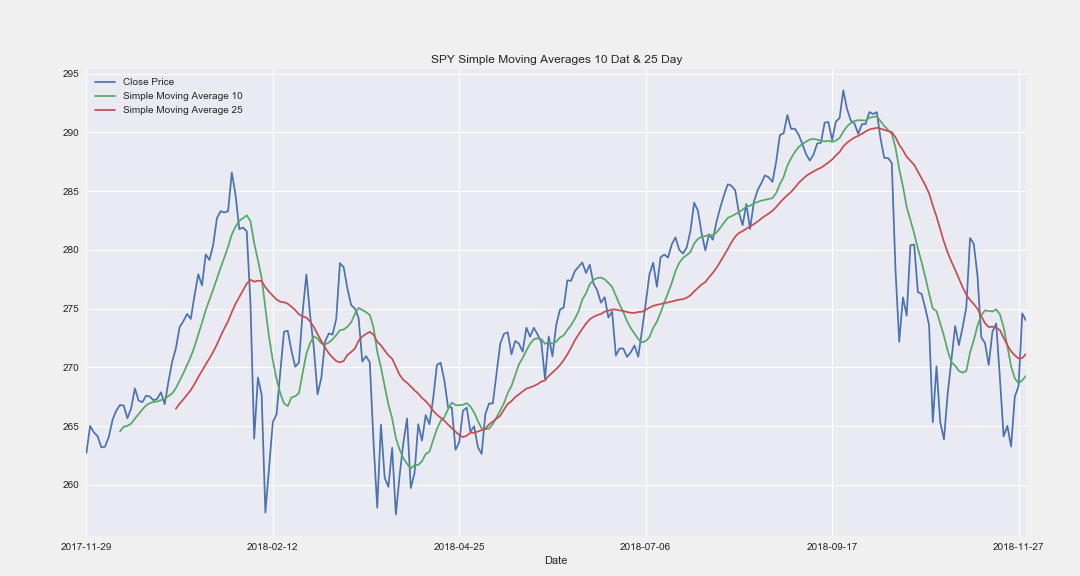
SMA
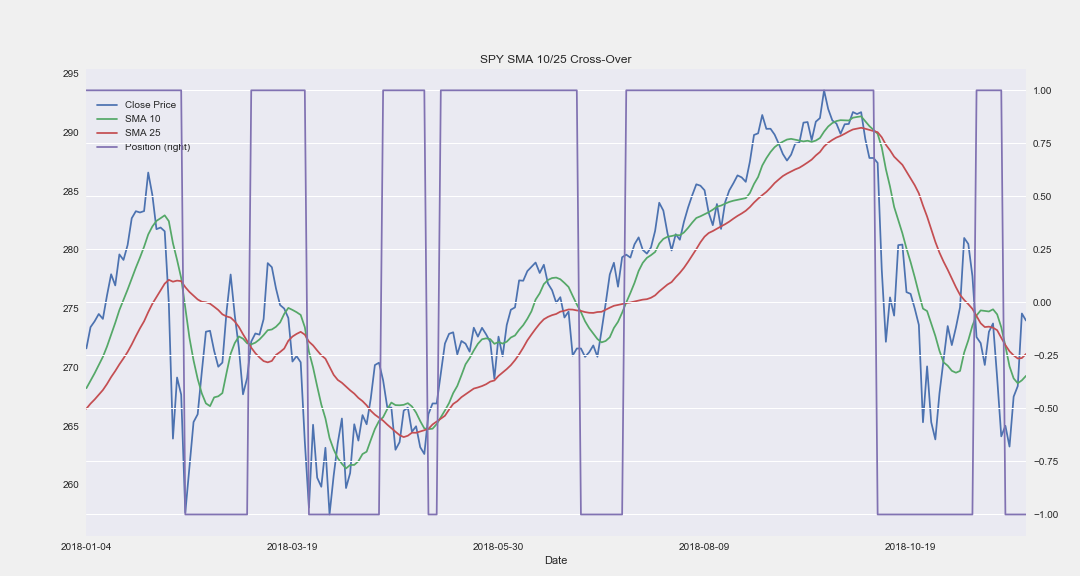
SMA Strategy
Volumes

Spent on Calls
Log Returns

Log & Calls