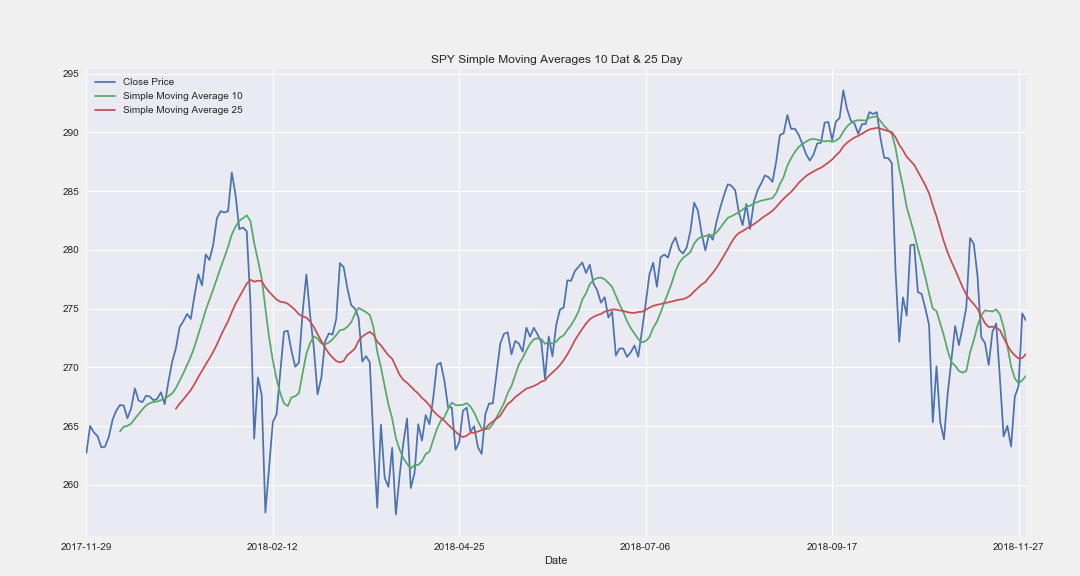
Simple Moving Averages 10D & 25D
A Simple Moving Average is a technical indicator devised using rolling statistics. It is an arithmetic moving average calculated by adding recent closing prices and then dividing that by the number of time periods in the calculation average. The graph displays two moving averages: The 10 Day Simple Moving Average and the 25 Day Simple Moving Average. Moving averages can be used in trading strategies to indicate if an asset price will continue or reverse an up or down trend.
Visualizations
SMA
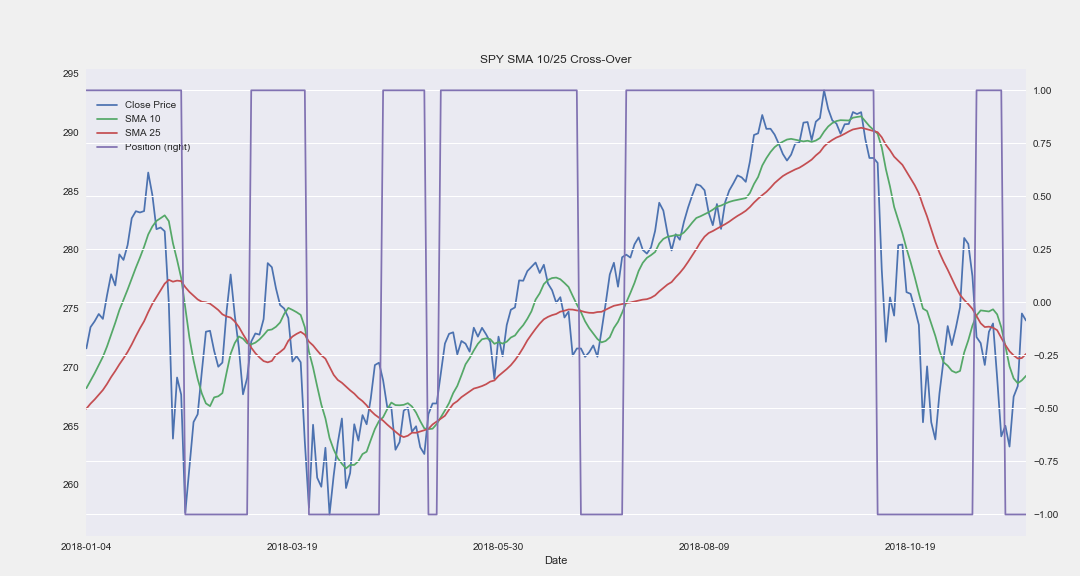
SMA Strategy
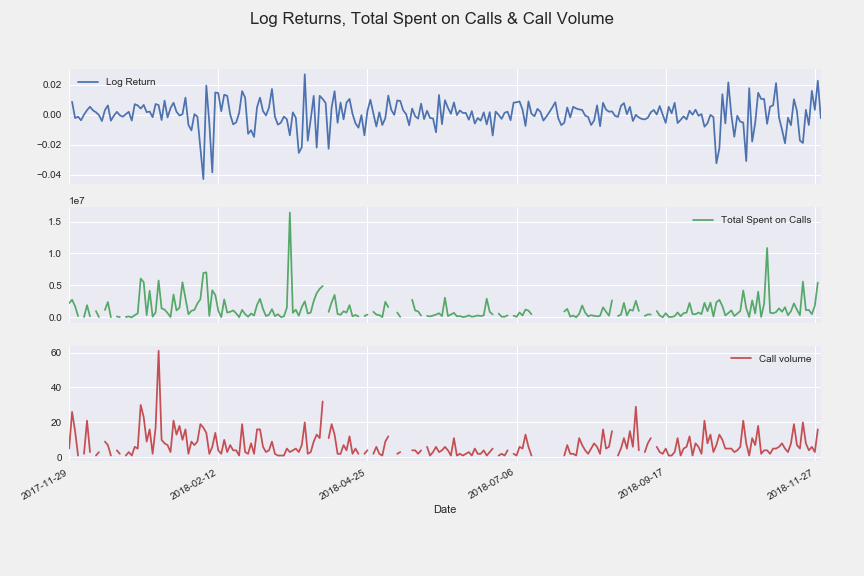
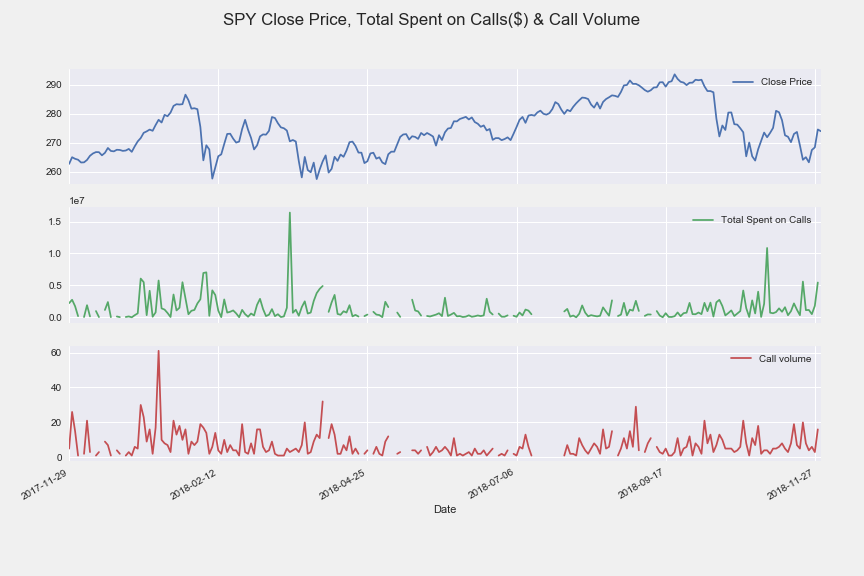
Volumes

Spent on Calls
Log Returns

Log & Calls