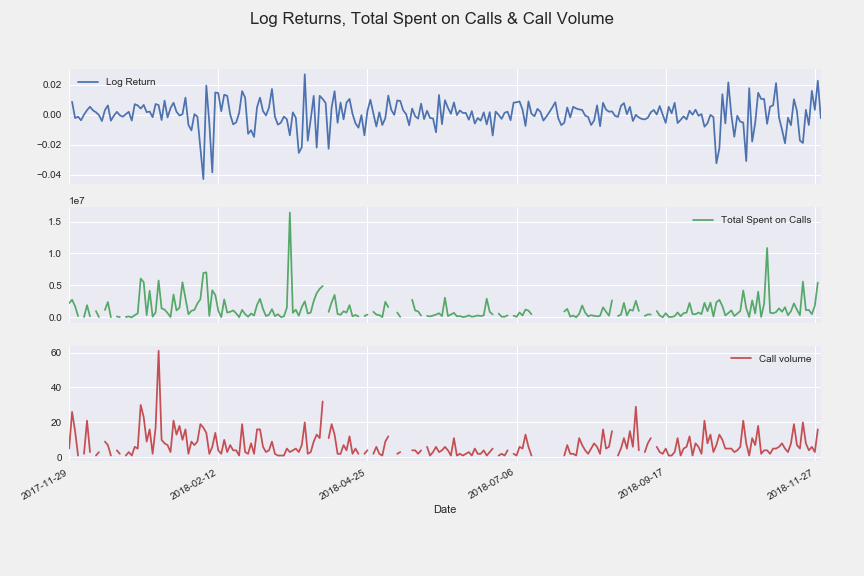
Logarithmic Returns and Call Data
Similar to the analysis done for the "Spent on Calls" analysis, this graph looks at the total spent on calls for the day and the total volume of calls for the day, but instead of closing price, it looks at the logarithmic (log) returns for SPY. Using the log returns normalizes the data which can allow for additional statistical analysis and modeling like regressions and correlations.
Visualizations
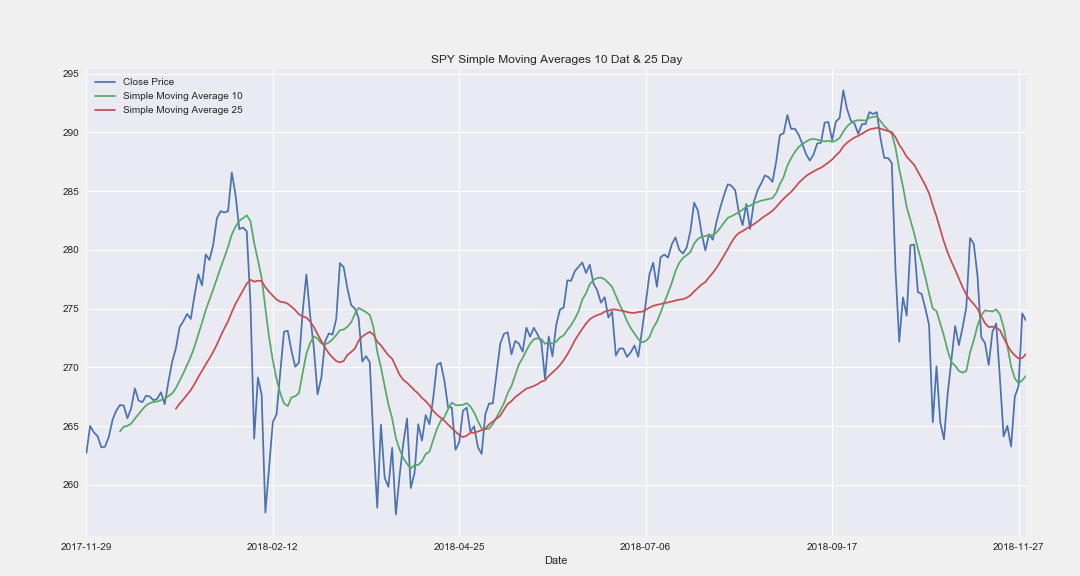
SMA
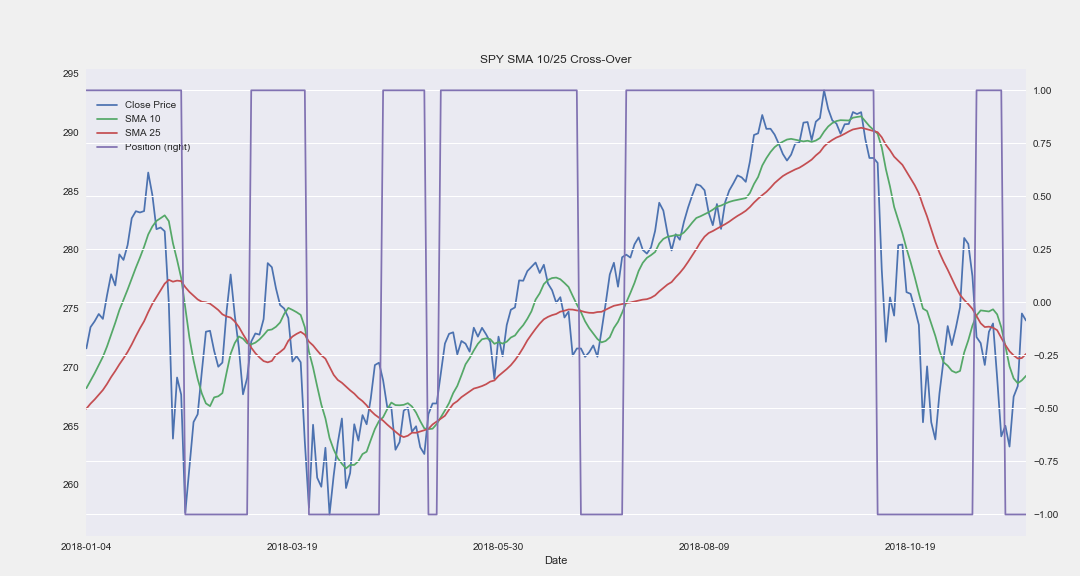
SMA Strategy
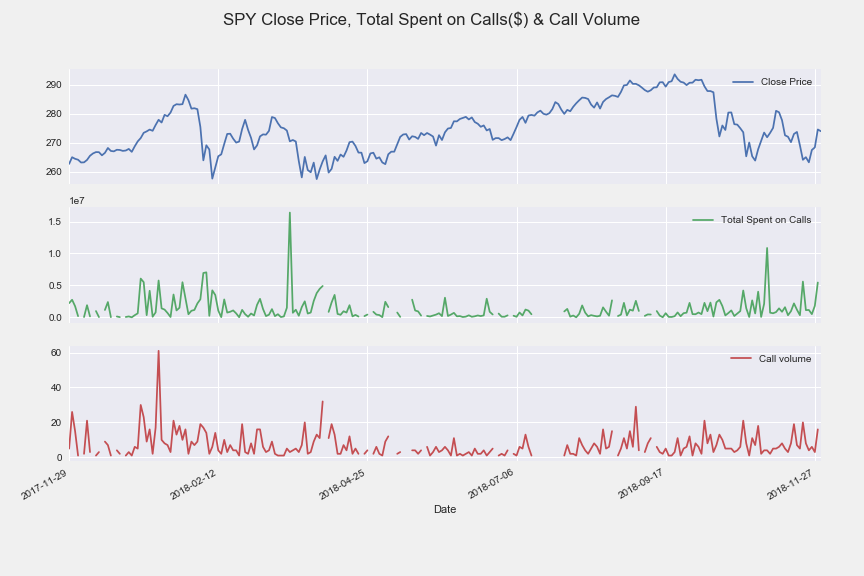
Volumes

Spent on Calls
Log Returns

Log & Calls